It is said: “Be careful what you wish for, because you might get it”. And here is what you might get, if analyzing data related to E-learning. This post uses data from Google Trends, at this particular Corona-moment in time. Though; I´m not sure if we will appreciate all the conclusions we end up with.
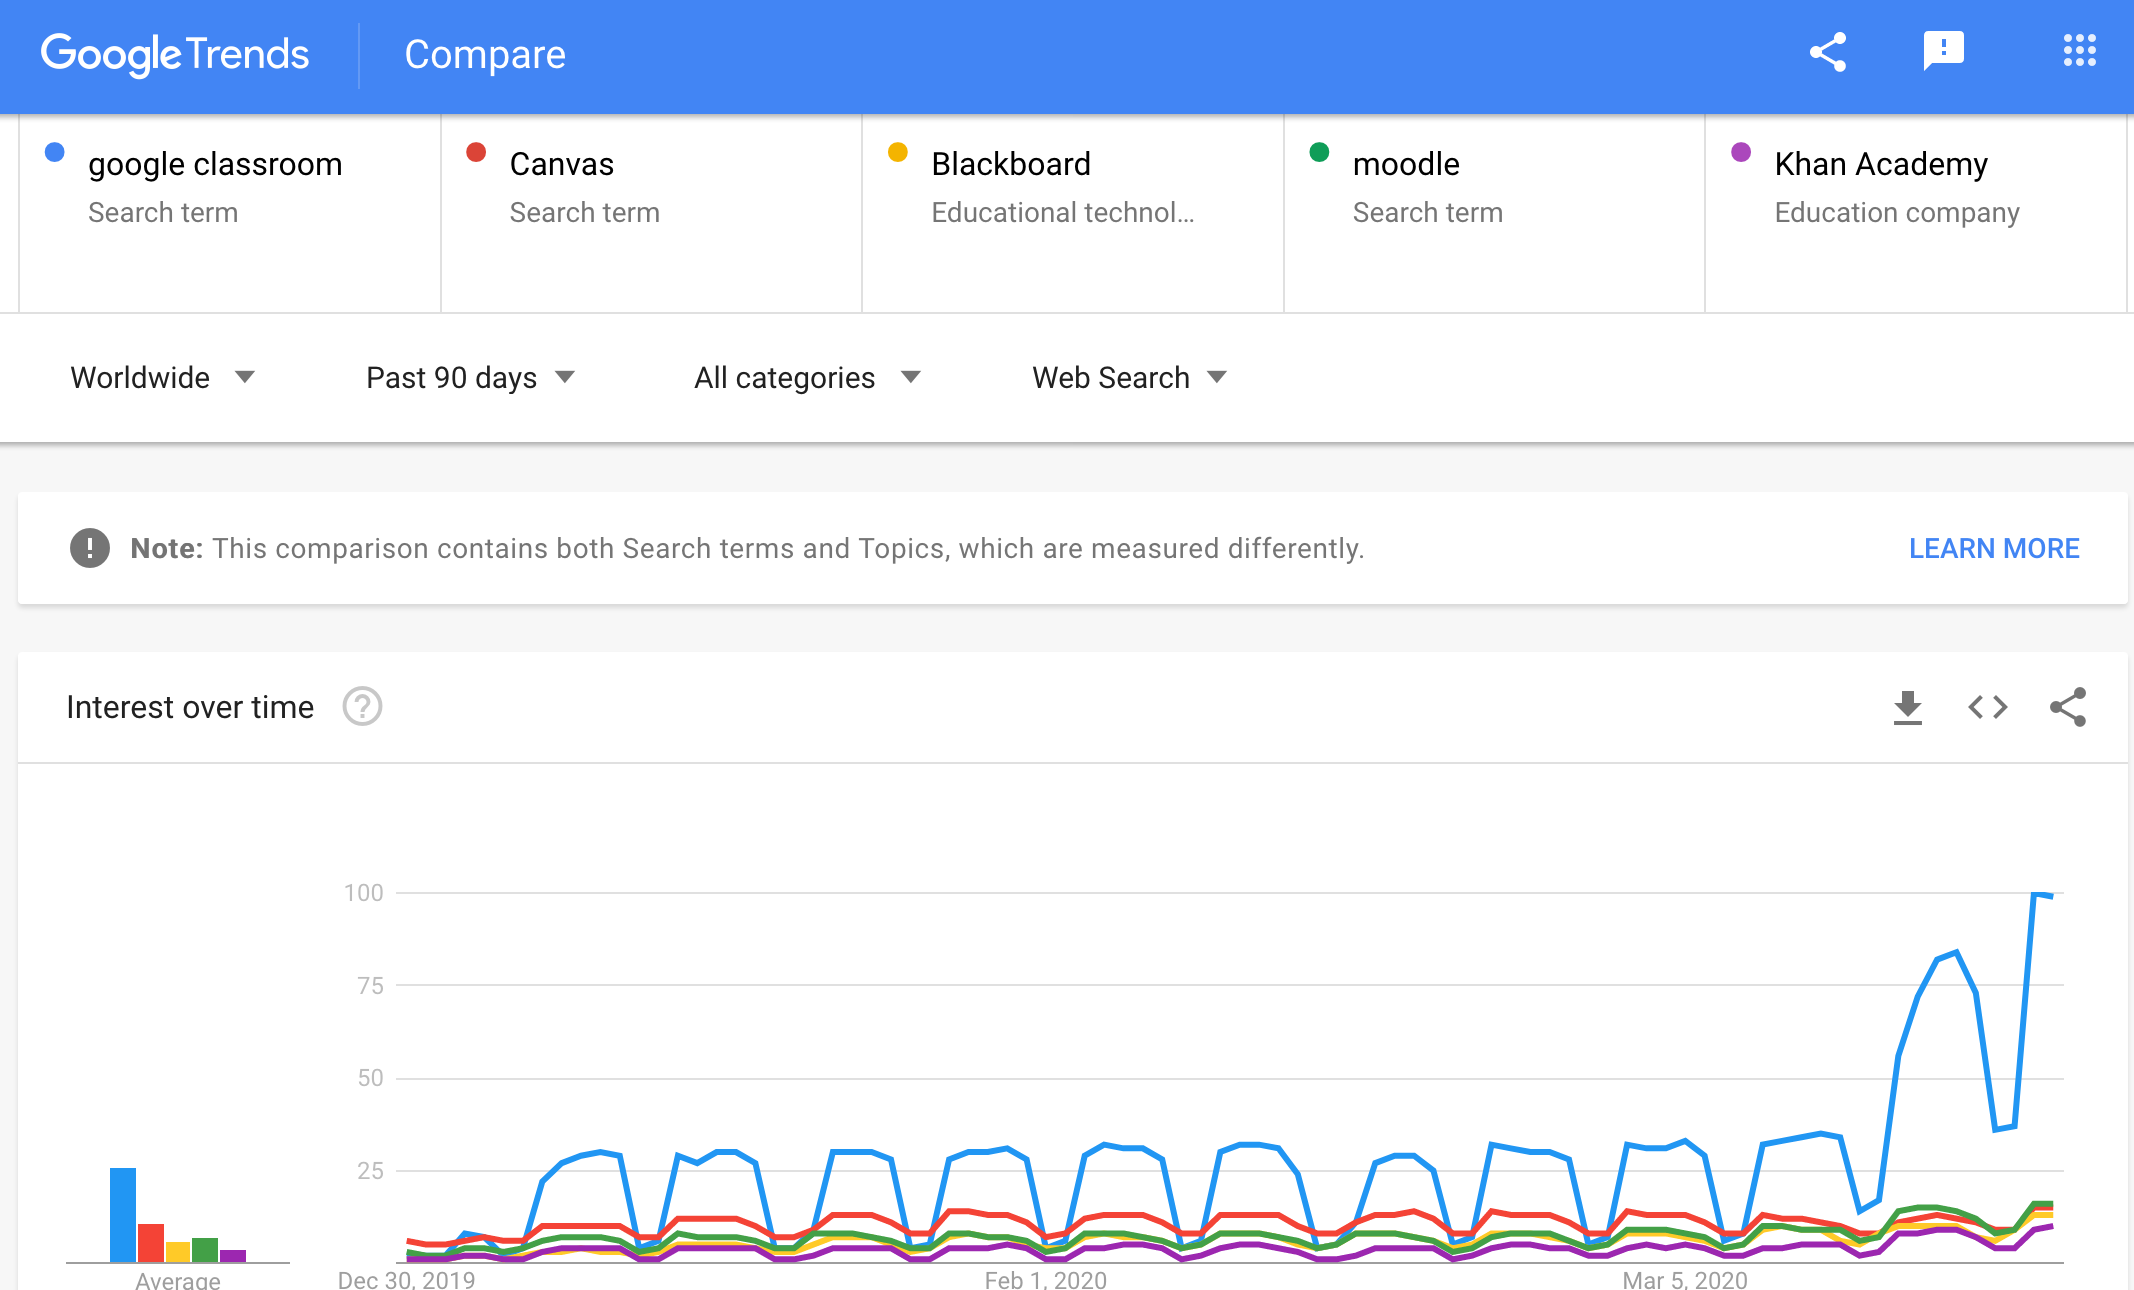
Below is Google Trends (it tell “what people search for on the web”, the higher value the more searches on a certain term). December 2019 up until today, Monday 30th March 2020.
Google Classroom, Canvas, Blackboard, Moodle and Khan Academy have grown recently. We probably see Corona-effects here. But Google Classroom is growing far more than the others. Is Google doing something specific at this moment? I don´t know. But it would be interesting trying to figure out if they are.
However, there is another interesting, but more long-term-oriented, pattern visible here; How come all off these curves go up and down, over time, in i a similar way?
 Correct; it´s weekends. Saturdays and Sundays.
Does that mean that students stop going for these services on Friday evening, and start again on Monday morning? I guess so. At least it seems reasonable to assume to be the case.
Let´s try this hypotheses, but with this picture instead. What does it tell?
 Here Zoom, Skype and Microsoft Teams are added; what we might assume to be some of the big “Video-conferencing-services” at this moment. Also all of them seem to grow. Was expected. Again; Corona probably.
But Zoom grow more than the others. Why? Well, I do not really know the answer but I have observed a lot of people now starting to use Zoom. I also have observed that several universities, for instance my own, is pushing for teachers using Zoom at this moment in time. Could Zoom become a “Skype-killer” soon?
Well, then maybe these curves also show that a lot of people in industry already are using Skype and/or Microsoft Teams. Why search for something you already have?
 Now try this: Disney+ is also in the picture. And growing a lot at this moment. Like Classroom and Zoom.
But Disney+ go up at the same time as all other services here go down. And when the other services go up, Disney+ goes down. Disney+ follow a totally different pattern. Why?
Well; it seem to tell that when we get closer to a weekend, interest in all other services go down, but Disney+ goes up.
 Does this then mean that people stop learning and communicating and go for entertainment instead during weekends?
Most likely no: we never stop learning. We just use different forms for it. We learn, also when using Disney+. We always learn things, even when we did not ask for it.
Could maybe all that we see here then just indicate that the founder of Disney ones managed to build a company that develop services that people tend to love so deeply that they even use it during weekends? If that is the case: What could then the E-learning-business learn from Disney?
And could all this indicate that the big winner during these Corona-times is actually none of all these services mentioned, but Disney+?
Be careful when you use digital data. You might end up learning things you never asked for. Or, maybe just get things confirmed that you probably already knew.
