We did not have Covid. Then we did it. Now almost, not really in the whole world but still; much of it is over. Where are we now? Here an analysis of some uniquely available numbers on digital traffic data from the university world. Campus; a different place? What will happen next? What to do?
200, 28 000 and 13 000. It´s the number of hours of ‘digital meetings’ per day; before, during and after the pandemic. This information is from the Annual Report 2021 for a public university in Sweden, in fact my own.
Now, this university may be among the few that actually share digital traffic data. Did not find much in other Annual Reports I have read; Harvard, Cambridge, ETH, other Swedish universities. A summary; ‘The pandemic was tough, but we made it, now here the same kind of text/figures, we always publish – finances, employees, students’. That’s all?

If you happen to have access to more data like this than I´m able to present, please share it. And please also help me to make sense of the data discussed here.
200 hours per day; before the pandemic. 28,000; during it. 13,000; after it.
What does these numbers on ‘digital meetings’ tell?
I believe the reality behind these figures is the use of Zoom and there are several good reasons to assume that beeing the case. The management team at this university strongly suggested Zoom when Covid came, many universities around the globe did – already well-known. Things had to change fast, Zoom was simple to start using. Students have aso confirmed that ‘Zoom became the big Covid-thing’. And LMS at this university; not possible for meetings, the use of it not measured in hours.
Actually; this university use Canvas as LMS; 200 000 ‘page-views’ per day became 500 000 during the pandemic according this Annual Report – Canvas; among companies like Blackboard and Moodle the biggest LMS-system on the globe right now, commonly used.
Long before Covid, courses at this university had a Canvas page/pages; used for announcements, video sharing, tasks, discussions, gradings etc. So I believe that the reality behind these Canvas-figures are students clicking on matters like these (what else?). Also teachers doing it are most likely included, but perhaps to a degree that is negligible.
Let´s think Zoom, clicks and individuals here. Real-life-thinking is important when trying to make sense of digital traffic data.
Regarding individuals; this university has 2,200 teachers employed; professors, lecturers, adjuncts. 1,000 of them are doctoral students, some teach quite a lot, others less, the same as with professors – this university also do a lot of research.
In total, this university has 4,000 employees, means 1,800 ‘adminstrators’. It also has 11,000 active full-time students – not all registered students are full-time, or active.
So, for this university as a whole before the pandemic; 200 hours per day at Zoom; the level of digital meetings – lectures, office meetings – and 200,000 page views per day on LMS; the level of Canvas-activities – document sharing, chat discussions, assignments, etc.
200,000 before the pandemic would actually mean 18 page views per student and day. That feels a bit high if we think hands-on (200,000/11,000). But if we instead divide it with students who run 4 courses at the same time, they often do, then that number can make sense (1 click per course and day to check new messages, documents, discussions, etc). That number then became 45 during the pandemic, unexpectedly high actually, but maybe still correct (perhaps also teachers really should have been included if thinking ‘per person’).
During the pandemic, the number of digital meetings became 28,000 hours, a big difference compared to 200. But we must remember; everything was then more or less closed down at this university. And this issue also includes office meetings.
But; regardless of whether 28,000 is knocked out to 2,200 (teachers only) or 4,000 (all employees), it will be a very high figure; 13-7 hours per person. Surely 28,000 hours must include students? 4,000 employees (lectures + office meetings) + 11,000 students (lectures + other meetings they might have without teachers participating) = 2 hours per individual / day. Then this number can start to make sense.
However; if we then go back to number 200, and all 15,000 people involved, the same mindset would mean less than 1 minute digital meetings per person/day, before the pandemic. And even if that number was just office meetings at that point in time; 200/4000 = less than 3 minutes. Not much of ‘digital meetings’ before Covid, no matter what we think is behind this number.
But actually, my guess it could be more like this in reality; the number 200 probably represent Zoom, just like the other numbers. But; already before Covid there was a decent number, not big but still, of digital meetings, probably nearly only office-meetings, not many lectures. However; all that was not primarily made via Zoom (I myself use at least 9 different meetings-services – part of the game when working in international research-projects). And then Covid did happen and that small number just got ‘swollowed/covered’ up by the big use/numbers of Zoom, so to speak.
This does not change the interpretation; this univeristy very likely did not have much of digital lectures before Covid.
Well, in reality, it could have been much more, or in fact much less, than 2 hours per day and per student at Zoom during the pandemic (also for employees, not the least admin-people). The figures here do not distinguish an office meeting between employees from a digital lecture and some students definitely had much more digital meetings, as well as much fewer, during different periods of the pandemic.
The numbers 28,000 vs 200, compared to 500,000 vs 200,000, clearly show something on overall level; at this particular university, Covid in practice meant huge number of Zoom lectures, and double use of Canvas, an LMS-system that, on the other hand, was already quite well used even before the pandemic.
The figure 200; before Covid. The figure 28,000; when the university was closed, but still up and running. 13,000; a while after Covid.
13,000 did neither go back to 200, nor did it remain at 28,000.
The figure 13,000 is from the middle of a new semester, during the autumn of 2021, when it was already decided during the summer of 2021 to start reopening this university during that semester. 13,000 is when the pandemic was more or less over for this university and an hybrid-strategy was applied – it is still as I write this, April 2022.
13,000 did not go back to 200, but it did not remain at 28,000 either.
Hybrid, in the case of this particular university, then actually meant this in practice; the university management decided to open up the campus, urged its employed teachers to return to physical classroom teaching, especially for first-year students, but allowed its teachers continue digitally, if they had pedagogical reasons to do just that.
Doing this interpretation of hybrid was quite wise by the top of this university. Imagine trying the same principle, no matter which one, online/off-line – would not work. Different subjects are different, different teachers are different. Some teachers also have really good pedagogical arguments for using Zoom instead of a classroom, as well as the opposite of course.
At most universities around the world, the single teacher makes the pedagogical decisions – what to actually do in a course (could also be done in a teacher-group, but not by the dean). Teachers know their subject. It should also not be forgotten that evaluation of pedagogical competence is part of the recruitment process of an academic. Could a potential dean, no matter who, really have made any other kind of ‘hybrid-decision’?
Going hybrid was then also something that was already expected when the post-covid situation was discussed in the middle of the pandemic. There have indeed been many post-Covid-hybrid discussions around the world, there still are, also within this university.
The figure of 13,000 just seem to be a measure of how a university of this kind act when that system allow it´s teachers to continue to apply the teaching-expertise post-Covid in more or less the same way as they always have done.
Now, why some teachers chose to continue driving at Zoom, these numbers do not tell. We can not even determine with these numbers if some students have actually pushed their teachers to continue running via Zoom post-Covid – some teachers follow what the students suggest.
The figure of 13,000 may in fact actually be considered a figure that is ‘after Covid’, although there may be some delay in that figure.
Well, delay time may actually be important here, to return to it soon.
When trying to make sense of the particular number 13,000, there are several things to take into account.
One thing, for example, to concider is that this is a university in Sweden, a ICT-savvy country. All students in Sweden have laptops, mobile phones. Broadband penetration; not far from 100%. The use of Canvas was also pretty high already before Covid.
Was a pretty big proportion of teachers and students at this university ready for digital lectures even before Covid, the pandemic just gave them one ‘last push’?
Well, at least I have heard things like this, from teachers as well as from students, during the pandemic; “Whops, Zoom works” – have also heard the opposite, even with strong voices.
Another thing to take into account is that we are analyzing a technical university. One could expect such teachers, including its students, to be a little more ICT-savvy, even more interested in ICT as such, compared to people at other universities. One might even expect such teachers to develop digital tools that, from a pedagogical, as well as research-related point of view, could be much more interesting than a meeting at Zoom, or a classroom lecture.
Could the Covid period as such actually have meant that many teachers and students who were not ready for digital lectures before Covid really got ready for it during the Covid period itself (bear in mind; at this moment there are also students enrolled into programs that never, ever, have had physical lectures at this university – what then to compare with)?
Well, at least I have seen really mindblowing digital educational-solutions, way beyond Zoom, beeing developed among collegues during this period – particularly by scholars in the field of ICT (have also met students that really don´t even know their own ‘classmates’, have never been in the same physical room, as well as disappointed students missing their study-friends).
At the same time, there is a fairly strong tradition in Sweden of low hierarchies between university teachers and students that should be taken into account – nearly only students from Asia tend to call me ‘Mr Professor’, while Swedish students tend to smile a bit on that (they are probably a bit to young to understand global differences in culture). So, open, lively, discussions in the classroom are very common, not strange at all to have. This may indicate that employees, as well as students, at this university would prefer to return to the classroom after Covid instead of continuing via Zoom.
Could this tradition be an important explanation why number 13,000 did not stay at 28,000?
Well, there are probably much more than this to take into account when trying to understand the number 13,000.
All this just underlines how difficult it really can be to make sense out of digital tracking. But on the other hand; number 13,000 can help us start asking interesting questions we perhaps did not even think about asking ourselves before we had this number.

Sweden applied a slightly different Covid strategy than many other countries. ‘Lock down’, in practice, meant that this university was indeed more or less physically closed. But that did not mean that all employees were locked out and banned from the office, even though it became extremely common to work from home – was also strongly recommended by the top of this university.
The Swedish government gave strong recommendations for the whole country to work from home under Covid (not ‘decisions’). But it never became illegal to go to an office, not even illegal for a student to visit a campus – if they could then physically get in, another question.
There were no physical classroom lectures at the universities in Sweden during Covid. Door locking was also done literary due to a formal government ‘decision’, something that the dean at this university just implemented. In fact, all universities in Sweden carried out the same procedure – they are public, they follow the government. If then everything that happened was based on decisions, or recommendations is a bit like ‘potato, potatho’.
In practice; the campus at this university was more or less empty during the pandemic.
I personally made a hand full of visits to this campus during that period. I work there; needed to collect things, had to do things, was also a little curious of course. I do not think there are figures on how many/few employees were actually on campus during this period, but if you ask me I would say; sometimes perhaps 5% of all employees there, other times close to 0 % – maybe a little more at buildings where only administrative people work?
A very small proportion of the students, such as a handfull, could sometimes actually also be observed, they mostly seemed to by studying at different places on campus (tables in corridors, in seminar rooms etc.). These students seemed to live in the student housing on campus, the ones I asked was – a short walk and better than sitting alone in a small room? After all; it is not extremely difficult to actually get in at a ‘locked campus’.
But except that; campus was really empty, felt like a ghost town.
Still; this university was up and running all this time and as far as I can tell; nothing really broke down – nothing of the kind of possible disasters is mentioned in the Annual Report from which the figures here are taken (not in any Annual Report I have read).
The figures here show that a university that before Covid did not have much of digital lectures, in a short time managed to switch to a Zoomified lecturing, and remote-working, world and still continue to be up and running.
That fact is in many ways an impressive thing, not to forget.
Does this also mean that this university now feels that it is possible to raise the bar for educational innovations and how to think about remote-work in the future?
Knowing that something you previously did not think was possible is actually possible can be useful.
Covid showed; it is really possible to run a university 100 % online.
But the numbers here also suggest; only half of all classrooms seem to be repopulated after Covid.
If 200 means close to 0% digital lectures, and 28,000 means 100% digital lectures, then 13,000 should mean 50% digital lectures, then such an interpretation may actually be reasonable to do.
It seems that about half of this university is still giving lectures digitally at this moment.
Is it really like this on campus right now?
The figure of 13,000 may indicate that life on campus after Covid is relatively small now, compared with before Covid.
Is, still, 50 % of all lecturing run digitally?
Imagine that it really is so. It would be like 50 average classrooms empty – this campus has about 100 classrooms. 50 rooms, average area 50 sqm = 2,500. The alternative cost for vacancies in Stockholm is then different depending on what we compare with (corporate office, appartments, whatever).
The answer to the questions about what really has happened to this campus after Covid can not be answered by these numbers. To really know what has happened, you probably need to go through the entire campus areas and look into existing classrooms.
My own feeling from this campus, right now as I write this, April 2022, is that there is actually much lower traffic volume compared to before Covid. But really; I have not gone through all the classrooms, have not walked through the whole campus area. And emotions so often in life are simply wrong, at least not representative. So, how could I be sure that this campus, still, is 50 % empty, eventhough I believe that it really could be the case?
These figures could indicate that something permanent may have happened.
Is it, still, to early to really tell, or can we know?
This university has approximately 230,000 square meters of facilities; classrooms, offices, laboratory spaces, restaurants, corridors, etc. 2,500 compared to 230,000; only 1%. Yet; if 50% of lecturing is not physical; how much of the other space is used then?
Formally speaking; On Wednesday March 18, 2020, the Swedish government ‘recommended’ all universities in the country to close, they also did – at this university; happened on Monday March 23, just three working days later. The last restrictions in the country as a whole were then totally removed by the government on February 9, 2022 – I write this in April, 2022. In between; all universities gradually opened in the fall of 2021, following a government ‘recommendation’ to discontinue distance learning from June 1, 2021. Fall, in Sweden, means end of August, meaning that recomendation was given two months in advance.
This campus was more or less completely closed, at least a little longer time than a full year.
How long does it take to turn a new pattern of behavior for such a big operation back into an old one? Is that even possible to do? If so; to what degree?
About 15 years ago, the large student union building on this campus was closed for a year; major renovations.
It took at least 10 years after reopening before the volume of traffic was at a decent level again.
Maybe this university could now only reduce the classrooms a bit and then just continue. 1% less space is not so much to care about, if you look at it that way. But downsizing easily becomes a raise to the bottom, if you do not do something else important at the same time, that is.
Think about this too; if a student has 4 different courses at the same time, and 2 of them run digitally, that student will be left with maybe only one hour on certain days of physical campus-based teaching. Will that student attend this particular single physical lecture?
Is there a kind of threshold to take into account here? If so; what does it contain of?
If I’m among the few left in this physical classroom, why should I attend, if the others do not?
A possible quote made by a student, or perhaps instead by a teacher.
This university could also just rebuild some of its classrooms into something else, such as group rooms perhaps. I’m hearing a lot of rumors about it right now. I also see some changes already in action, especially concerning office space. It would be/was reasonable to expect.
But how many of the students, and employees, who live elsewhere than on campus, would in the long run voluntarily travel to campus, when they have learned during Covid that meetings can be digital, also be held elsewhere (of course people occationally met physically in Sweden during Covid, just not at Campus, at student housing and back home for instance)?
The completely dominant strategy that most universities in the world seem to choose after covid is ‘hybrid’. It may be the consequences of hybrid that we see in these figures.
Well, we may also just have to wait before we can really know what happened.
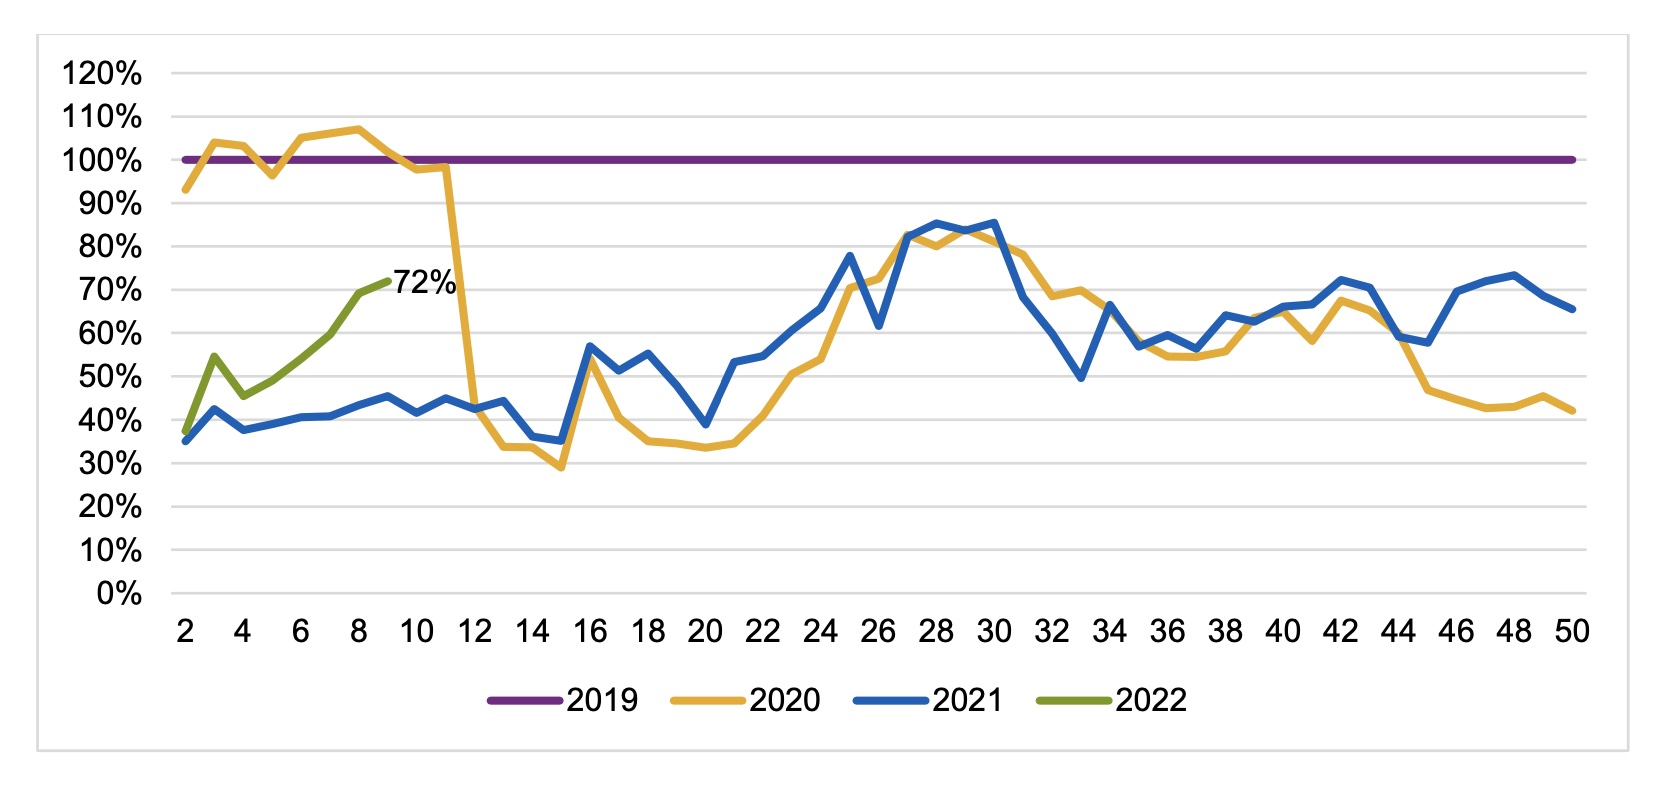
The graph below is interesting when it comes to the idea of waiting a little longer before raising an opinion about what to do now, if even anything at all actually should be done that is. It is based on really fresh data, updated to March 2022.
What we see in the graph is mobile-phone-traffic data on 7 different campus areas in Sweden, including the specific university that has already been discussed. It´s from a newly published report made by The Swedish Higher Education Authority.
Maybe this graph is based on the ‘least bad’ traffic data sources we can use at the moment as I write this. And really; what kind of data should we instead use if we wanted to know something about the ‘real’ traffic volume at a campus-area – has any university on the globe even ever tried? Coffee cups sold at the campus restaurants? Infrared cameras that count people passing by certain locations? Traffic volume at the subway-station close by the main entrance to a campus (actually not a totally crazy idea, but only concerning the particular campus discussed here – others might not have such stations close by)?
When we try to make sense of this graph, we must remember; this is cell phone traffic data, nothing else. We must also remember; data are indirectly related to how radio base stations are physically located – parts of areas outside the campus are therefore also included (my own university is for instance close to a major train station within the city and also people that work downtown use it). We must also acknowledge; this graph shows average numbers, not only the particular campus just discussed – I don´t have access to data for each single university.
These curves might indicate that traffic is now increasing at campus, week 2-9 this year, 2022. March; 72 % compared to before the pandemic. Are we now, but just with a delay, getting closer and closer to getting back to how things did look before the pandemic? Or, do we trick ourselves when assuming this curve going up? Week 2, 3 etc is after New Year and it normally takes some time to put universities in Sweden up to speed after holidays.
Ading to that; the traffic volume throughout the whole time-period in this graph is constantly higher than 30% during all these years (bakground noice, whatever). It may mean; perhaps the real comparison baseline should not be at 0 % but at 30 %. And in such case, the traffic volume now, March 2022, is still not much more than 50% compared to before the pandemic (the midpoint between 100 and 30). It could indicate; perhaps Zoomified lectures still, at the moment as I write this, April 2022, remain at the same level as in the middle of autumn 2021. Would be a similar level as the previously discussed number on Zoom-data indicated – then no change during the last four months.
72 %; perhaps not so much to care about? 50 %; something to seriously care about?
Is it really possible to imagine that the Covid period leaves no lasting traces at all?
Between one and two years closed, then just back to square zero?
Let us summarize this whole analysis using a question; does anyone really know where universities are post-Covid right now? My faith is; In fact, no one does, and nor can this analysis clearly say where we are.
We simply, still, do not know the extent of any possible lasting traces that Covid may have left behind, even though there are signs that something pretty important may actually have happened – as shown by some of the figures analyzed here.
But an exercise like this can at least make us a little more interested in digital tracking data.
-> Perhaps share this post with someone who enjoy the challenge of trying to make sense of digital traffic data and care about the future of educational institutions.
